About
I also develop an enthusiasm for data analytics and visualization. See my work below.
Nguyen Nguyen
Inspired by the American Dream Downpayment Initiative Program, I'm currently working in mortgage industry. I promise to use my expertise in bringing many thousands of families closer to the great goal of owning a home. My team and I are helping families achieve their goals, strengthen our communities, and our entire nation.
What I Do
Skills
Analytical
Project Management
Communication
Negotiation
I Qualify Borrowers for Homeownership

I consider myself being a part of a customer-centric culture that concentrates on borrowers. We all work together to expand borrowers' lending options, close loans ahead of schedule, and create innovative new loan solutions.
ACG Cup M&A Case Competition
Second place at the 13th Annual ACG Cup
Pitted against UTSA, UT Dallas, University of Dallas, Texas Southern University, University of Houston, and Texas Christian University
Presented valuation, capital markets and M&A strategic advice to a panel of professionals
Picture galery
Beta Alpha Psi
Founder and first president of BAP UST Chapter
BAP internationally distinguished status for the academic year 2015-2016
UST annual community award for raising awareness of literacy in low income area
Point of Light video
Joyce Merrill Valdes Scholarship
Awarded for best combine academic excellence and leadership with international awareness and cross-cultural understanding
Guest speaker for LCC student level 5/6 year 2016
Featured on Voices
Dean’s Recognition
Dean's Award for contribution to student leadership and member of student advising board to the Dean
Picture galery
CSB Blog Contest Winner
First place on blog contest for business school students on behavior finance topic
Link to the published article
Beta Gamma Sigma
Top 10% of business school for academic achievement
Recognized and honored as top performing students from around the world in business schools accredited by The AACSB
Picture galery
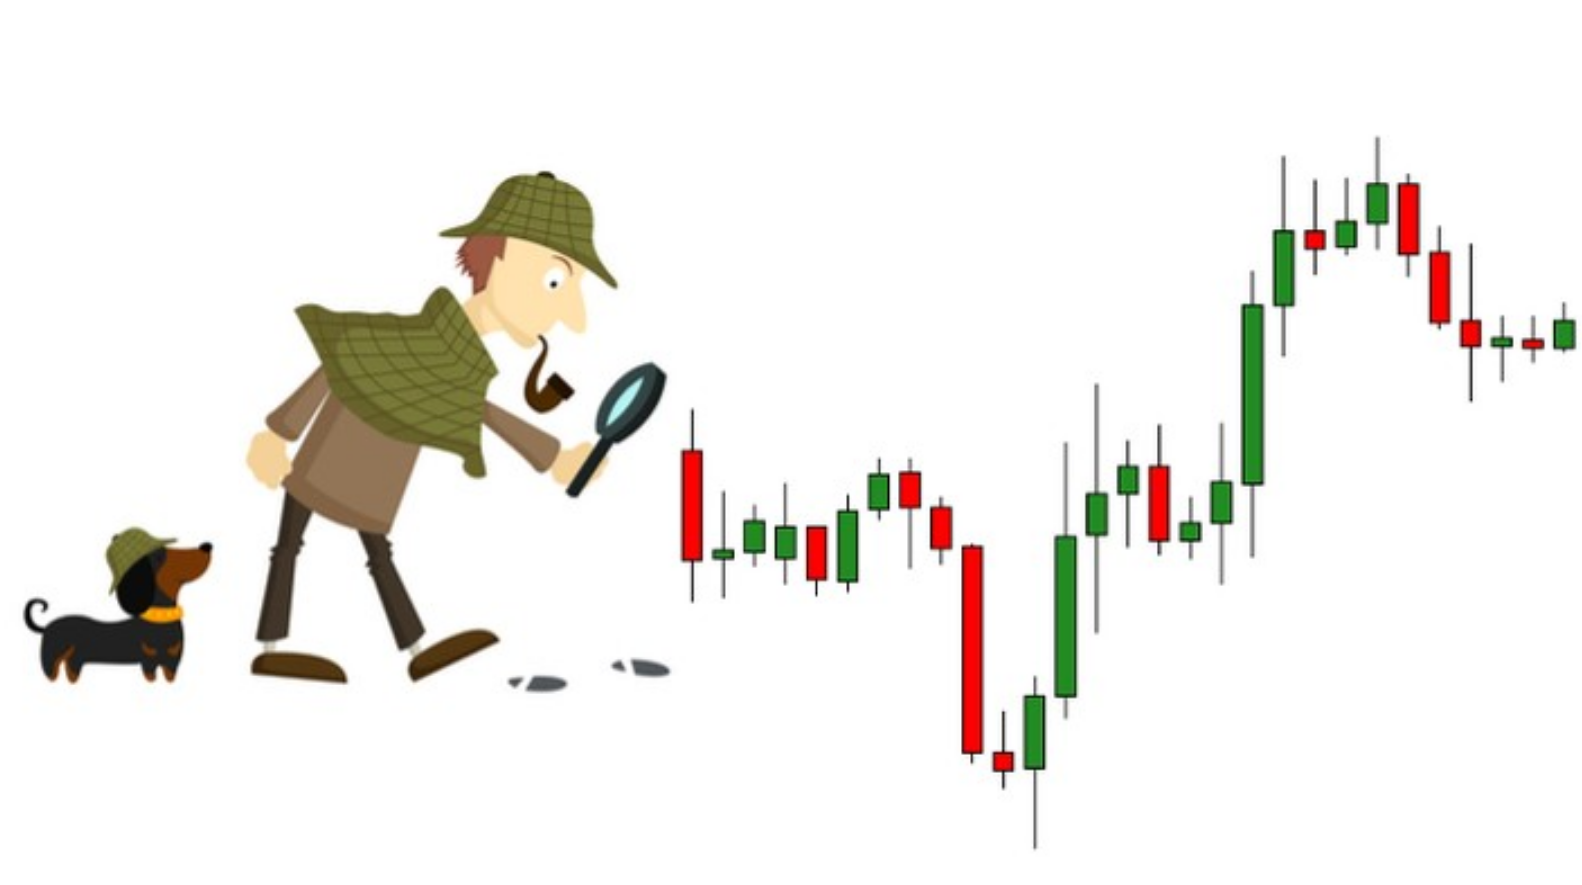
Recent Work
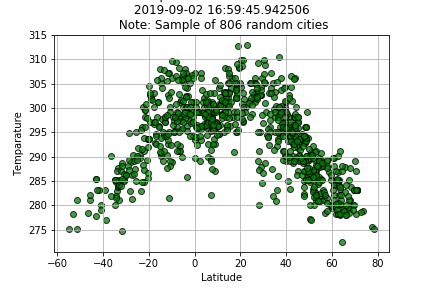
Weather Pie
A visualization dashboard website using live data from API calls of more than 500 random cities around the world. Especially, weather data were plotted for user's convenience. In building this dashboard, I created individual pages for each plot and a means by which we can navigate between them. These pages contain the visualizations and their corresponding explanations. The dashboard also has a landing page, a page where we can see a comparison of all of the plots, and another page where we can view the data used to build them. Click here to access the dashboard.

UFO Sightings
A tool using JavaScript code so users can choose to set either single or multiple filters to search for UFO sightings. Features:
- Username and password input for sercurity purpose
- Event listeners to allow appropriate access to particular users
- Interactive sumary output based on user filter input
- Animated CSS layouts
Click here to explore more. Note: Use password "coding" for username Jonathan.

Houston Housing
"What are factors that affects housing’s values/prices in Houston?"
- API calls to retrieve data from ACS
- Pandas and Python utilized to clean up and store data
- MatplotLib to plot charts and correlations
Project scope is Harris County (133 zip codes- 22 cities) with a focus on Houston Area (100 zip codes, divided into 5 regions: Inner Loop, Northeast, Southeast, Northwest, Southwest). Click here for final insights.

Belly Button Biodiversity
Full stack Flask app deloyed in Heroku using HTML, JavaScript, CSS, python and sqlite. This interactive dashboard responds to sample selected and builds plots accordingly: A table to display sample details, a pie chart for top ten bacteria of the sample, and a buble chart to display sample values. All of the plots are updated any time that a new sample is selected.
Click here to experience interactive charts.
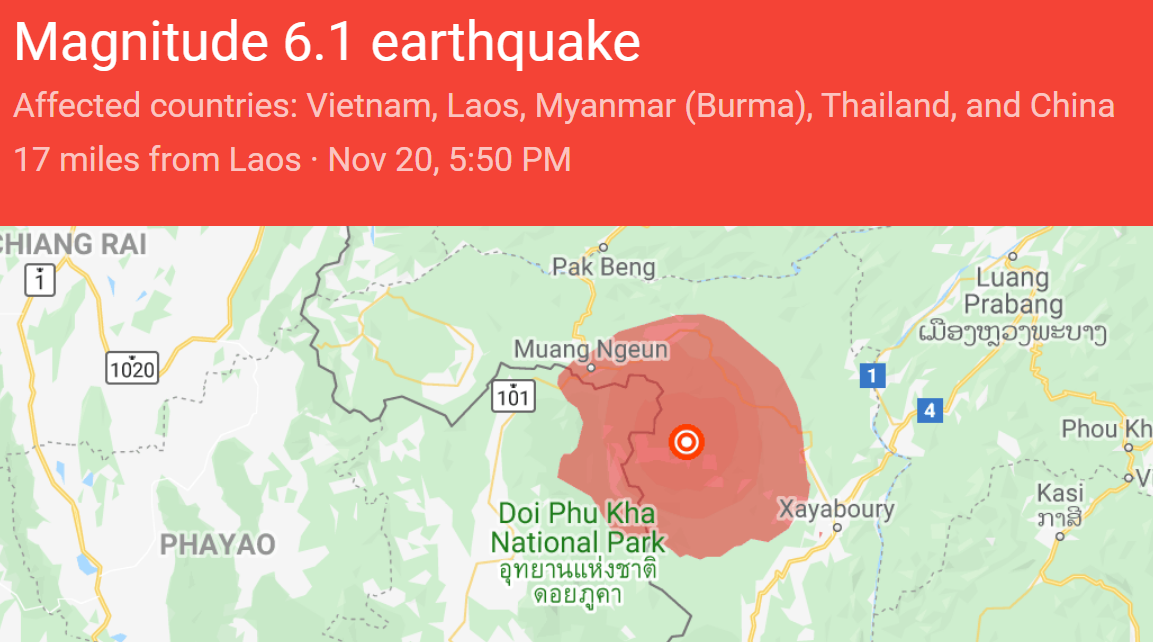
Real Time Earthquakes
Meaningful tools to display massive earthquake data from all over the world based on USGS. This is a map using Leaflet that plots all of the earthquakes based on their longitude and latitude.
- Real time data from the past 30 days, updated every minute
- Markers reflect the magnitude of the earthquake in their size and color. Earthquakes with higher magnitudes appear larger and darker in color
- Popups that provide additional information about the earthquake (magnitude, time, and location) when a marker is clicked

Flask Foodies
Mini project with an aim for comparision of how different kind of cuisines are popular between Houstonians and New Yorkers.
- Yelp API for data source
- Leaflet map side-by-side and Zoombox for heatmap comparision on restaurant ratings between two cities
- Leaflet control allows user to select different cuisine category for visualization
- D3 and plotly bar chart and pie chart for comparision on number of restaurants and averate ratings among restaurants
Click here to see final insights.